


Unlocking the Mystery: How to Spy on Buttons in Dynamics 365 Like a Pro
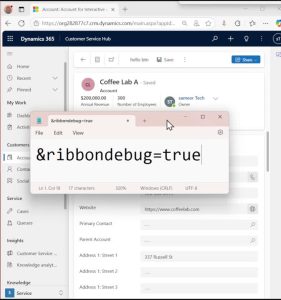
Have you ever clicked a button in Dynamics 365 model-driven apps and thought, “What magic is making this work?” 🤔 Well, prepare to feel like a detective uncovering secrets! 🕵️♀️ There’s a simple yet powerful trick: just append &ribbondebug=true to your app’s URL. Hit Enter, and voilà—the Command Checker springs to life, ready to reveal everything happening behind the scenes. It’s like having X-ray vision for your buttons! 💡
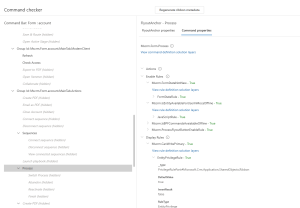
Once the Command Checker opens, you’ve got a treasure trove of insights at your fingertips. You can easily find button IDs, command properties, and the web resources tied to those buttons. But here’s the kicker: when you’re editing the command bars for your model-driven app, the Command Checker is already available by default. ⚡ No need for extra steps—just hit play on the app, and you’re set to explore. It’s a developer’s playground, turning button debugging into a breeze!
Not only is this feature a lifesaver for troubleshooting, but it also transforms customization into an exciting adventure. Imagine being able to track down exactly what’s happening with every button click, without the guesswork. So, whether you’re coding, debugging, or just exploring, the Command Checker is your backstage pass to the Dynamics 365 show. Go ahead—append that URL or dive into the editor, and watch the magic unfold! 🚀